Unemployment Rate Down Because Employment Rate Down

It’s the EMPLOYMENT RATE (Labor Participation) that’s down, causing Unemployment to go down
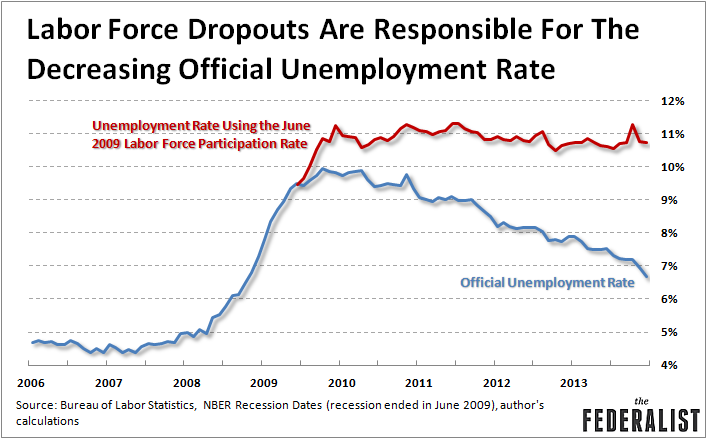
When you hear from some sources how well the economy is doing with the unemployment rate down to 5 1/2 % you better think twice. Take a look at these charts. The unemployment rate is only down because the overall labor force participation is way down:
‘The government counts only people actively looking for jobs as unemployed. The drop in labor force participation accounts for almost the entire net drop in the unemployment rate over the past five years.’
The current estimated labor force participation in May, 2015 is 59%, down a full 10% since 2007 (see chart 3). With more people out of work, food stamps and other government assistance is way up and disability insurance has been extended, causing more overall debt. Average family incomes are lower than in 2007. Maybe the banks are doing better, thanks to the ‘bailout’ but the large, shrinking middle class and growing poor are not. Meanwhile, trade talks of getting more goods from other countries will only further exacerbate the declining worker roles in the U.S. if said trade bills are passed.

The bogus unemployment improvement is another case of misinformation we get from media , which is regurgitated by ‘sheeple.’ The following charts clearly show the correct scenario and next time someone tells you how great the economy is doing you can show them these charts. The economy is based heavily on the employment rate and housing starts and neither has been doing very well except in limited areas.
So, next time someone tells you ‘unemployment is down’ ask them what the ‘EMPLOYMENT RATE’ is. Tell them NOT to look at the unemployment figure but at the EMPLOYMENT RATE.
Not Looking for Work: Why Labor Force Participation Has Fallen During the Recovery
By James Sherk, Heritage Foundation
The post-recession economy has undergone the slowest recovery in 70 years. In addition to more than 6 percent unemployment five years after the recession officially ended, labor force participation has fallen sharply since the recession began in December 2007. Today, 6.9 million fewer Americans are working or searching for work. The drop in unemployment since 2009 is almost entirely due to the fact that those not looking for work do not count as unemployed. Demographic factors explain less than one-quarter of the decreased labor force participation. The rest comes from increased school enrollment and more people collecting disability benefits. Over 6 percent of U.S. adults are now on Social Security Disability Insurance. This is no time to make it more difficult for businesses to create jobs.
Originally published August 30, 2012—Revised and updated September 4, 2014
The American economy is experiencing the slowest recovery in 70 years. In addition to persistently high unemployment, labor force participation has fallen sharply since the recession began in December 2007. Today, 6.9 million fewer Americans are working or looking for work. This drop accounts for virtually the entire reduction of the unemployment rate since 2009 because those not looking for work do not count as unemployed.
Demographic changes explain less than one-quarter of the drop in labor force participation. The Council of Economic Advisers (CEA) estimate that demographics explain half of the drop in labor force participation, but the estimate ignores the effect of rising education rates. The baby boomers are aging and thus more likely to retire, dropping out of the labor force, while the population has become more educated and thus more likely to work. These demographic changes together explain less than one-quarter of the drop in labor force participation.
The remaining drop in participation primarily comes from millions more people collecting Social Security Disability Insurance (SSDI) or attending school. While those enrolled in school will probably return to the labor force, those going on the disability rolls will not. They will remain permanently outside the labor force.

The difficulty of finding a job drives both these changes. Job creation fell sharply after the recession began and—unlike layoffs—has only partially recovered. The government’s responses have been ineffective at best and counterproductive at worst. The stimulus provided little if any boost to the economy and will depress the economy in future years. The Dodd–Frank Act has hurt capital markets and hurt businesses seeking to expand.[1] Federal Reserve Banks find many businesses reporting that Obamacare has made hiring more expensive.[2] Instead of public works programs and counterproductive regulations, Congress should reduce the tax and regulatory burdens that it imposes on businesses to encourage hiring and stop the fall in labor force participation.
The Slow Recovery
The collapse of the housing bubble and the resulting financial crisis sent the U.S. economy into a recession in December 2007. Recessions and financial crises are not unusual. The savings and loan crisis and the Volcker disinflation contributed to the recessions of the early 1990s and 1980s, respectively. The recoveries from both of these recessions were strong. Today’s economy is unusual in how slowly it is recovering.
Officially, the most recent recession ended in June 2009—the last month of the last quarter of the economic contraction that began in 2008. When President Barack Obama took office in early 2009, his Administration projected that unemployment would fall to 7 percent by the end of 2010 if Congress passed his stimulus package. The Administration warned that unemployment would hit 9 percent by the end of that year if Congress did not pass the stimulus package. Congress passed the stimulus, yet the unemployment rate hit 10 percent in October 2009 and did not fall below 9 percent until late 2011.
Not until May of 2014 did total employment reach its pre-recession peak—five years after the recession formally ended.[3] May’s unemployment rate stood at 6.3 percent—the lowest since the recession began—but also matched the highest unemployment rate following the 2001 recession.[4]

This has been the slowest recovery in the postwar era. After every other recession, the economy fully replaced the lost (net) employment within two to four years of the recession’s onset. Investors and entrepreneurs rapidly found productive new uses for the millions of idled workers and billions in idle capital. Not since the Great Depression has employment remained below its pre-recession levels more than six years after a downturn’s onset.
Lower Participation = Lower Unemployment Rate. As high as the unemployment numbers are, they still overstate the economy’s performance. Since the recession began, the labor force participation rate—the proportion of adults either working or trying to find work—has fallen by 3.2 percentage points. The government counts only people actively looking for jobs as unemployed. The drop in labor force participation accounts for almost the entire net drop in the unemployment rate over the past five years.
Another measure of the state of the labor market is the employment–population ratio. This ratio shows employees as a proportion of all adults, both those looking for work and those outside the labor force. During the recession, the employment–population ratio fell sharply and the unemployment rate increased. Since then, the unemployment rate has improved modestly. The employment–population ratio barely increased.
The unemployment rate peaked at 10.0 percent in October 2009 and currently stands at 6.3 percent. The employment–population ratio has gone from 58.5 percent to 58.9 percent during this time. Unemployment has fallen because fewer Americans are looking for work, not because more Americans are finding jobs. Since the recession ended, job creation has only slightly exceeded population growth.
A Smaller Labor Force—What It Means
Understanding why labor force participation has fallen is critically important to assessing the state of the economy. When millions of people would like to be employed, but have given up on finding work, the official unemployment rate understates the weakness of the labor market. It omits millions of potential workers who have become so discouraged that they have stopped job searching.
On the other hand, economists projected labor force participation to fall no matter what happened to the labor market. The first of the baby boomers turned 65 in 2011. People in their 60s work considerably less and have much higher retirement rates than those in their 50s. An aging population will push down labor force participation whether the economy does well or poorly. The aging of the baby boomers presents economic challenges for America, but these challenges have nothing to do with the cyclical state of the economy. If demographic changes explain most of the drop in labor force participation, then the unemployment rate accurately measures the health of the economy.

Examining the Drop in Employment. The Bureau of Labor Statistics (BLS) surveys a representative sample of tens of thousands of households each month. The BLS reports the proportion of Americans who are employed, unemployed, and not in the labor force. People outside the labor force do many things: enjoy their retirement, study in school, collect disability benefits, take care of family members, or fight illness.[5] The BLS asks individuals outside the labor force what they are doing, but does not regularly report these details.
The Heritage Foundation analyzed microdata from the BLS’s Current Population Survey to break down the changes in employment, unemployment, and those outside the labor force. Table 1 shows the changes in these figures between 2007 (the last year before the recession) and 2013 (the most recent full year in the recovery).[6] Table 1 also shows how those figures would be different if the employment, unemployment, and not-in-labor-force rates had remained constant between 2007 and 2013.[7]

Between 2007 and 2013 the employment–population ratio fell by 4.4 percentage points, while the unemployment–population ratio increased by 1.6 percentage points and the labor force participation rate fell by 2.8 percentage points.[8] If employment and unemployment had remained at their previous rates, 10.8 million more Americans would have jobs, meaning 4.0 million fewer unemployed Americans and 6.9 million more Americans participating in the labor force.[9]
Three categories explain the bulk of the decrease in labor force participation. The proportion of those outside the labor force and attending school has risen by 0.8 percentage points (1.9 million people), the proportion collecting Disability Insurance has risen by 0.9 percentage points (2.1 million people), and the proportion of retirees increased by 1.2 percentage points (2.9 million people). The proportion of those outside the labor force and spending time with family (–0.1 percentage points) or outside the labor force for “other” reasons (+0.1 percentage points) changed only slightly. The proportion of those not working due to illness remained constant.
These figures do not reveal what portion of these changes demographic changes caused and what portion the recession caused. The aging of the baby boomers should naturally cause more Americans to retire, pushing down labor force participation. Conversely, the generation of workers currently retiring has less education than the generations succeeding them. More educated workers have higher labor force participation rates. Rising education levels increase labor force participation.
Change in Labor Force Status by Age. Table 2 shows the change in the employment status of the adult population by age and education categories. The recession has not affected everyone equally. Workers ages 16 to 24 experienced the largest drop in employment (–6.6 percentage points) and the largest increase in those outside the labor force (+4.5 percentage points). Conversely, the employment rate of workers 55 and older increased noticeably (+0.8 percentage point), and the proportion of those 55 and older outside the labor force fell by 1.9 percentage points.
The latter change is driven by a sharp decrease in retirement rates (–2.5 percentage points). Older Americans are less likely to retire now than before the recession began. However, workers 55 and older are still more likely to be outside the labor force (usually retired) than any other age group. Consequently, the aging of the population has increased the number of retirees even as the retirement rates of older Americans have fallen.

The increase in Disability Insurance varies only slightly by age group. Workers in all age groups were between 0.6 and 0.9 percentage point more likely to receive Disability Insurance in 2013. The same is not true of schooling. The largest increase in those outside the labor force and attending school unsurprisingly came among younger workers (+4.0 percentage points).
This does not necessarily mean that younger Americans are enrolling in school at a higher rate than in 2007. The “employed” and “not in the labor force–in school” categories are mutually exclusive. These figures could also mean that students who in the past would have had part-time jobs now cannot find work. Thus, they are classified as outside the labor force instead of as employed. These figures show how the activities of those outside the labor force have changed. They do not show whether those outside the labor force and in school would take jobs if they could get them.
Change in Labor Force Status by Education. Table 3 shows how the labor force status has changed by educational attainment.[10] Even before the recession those with more education were more attached to the labor force and had lower unemployment rates. The burden of the recession has fallen heaviest on those with less education. The employment rates of those with less than a high school degree (–5.8 percentage points) and high school graduates (–6.4 percentage points) have fallen the most. These groups also have the largest decreases in labor force participation (–4.3 percentage points for each). Workers with bachelor’s degrees saw considerably smaller (–3.8 percentage points) decreases in their employment rates and labor force participation rates (–2.4 percentage points).

A substantial part of the drop in labor force participation for workers without a high school degree comes from those enrolled in school (+3.9 percentage points). A large number of these individuals are younger Americans studying in high school. The recession has encouraged many of them to continue their education because they will have difficulty finding work if they drop out. Similarly, difficulty finding part-time jobs has caused many students to stop looking for work and thus drop out of the labor force, although they remain in school.
Table 3 also shows notable differences in Disability Insurance claims. The increase in workers dropping out of the labor force and going on Disability Insurance was greatest for workers with at most a high school degree (+1.8 percentage points) or who have not finished high school (+1.4 percent). Workers with a bachelor’s degree or a graduate degree were considerably less likely to increase their use of Disability Insurance (+0.3 and +0.1 percentage points, respectively).
Holding Demographics Constant. Older workers are less likely to participate in the labor force than younger workers. More educated workers are more likely to participate in the labor force than less educated workers. America became older and more educated between 2007 and 2013. Such demographic factors have put both upward and downward pressure on the labor force participation rate. Tables 2 and 3 demonstrate the importance of controlling for these factors.
One way to control for demographic changes is to calculate what the employment status of the overall population would look like if the age, sex, and education distribution of the population did not change but the employment status of each separate age-sex-education group changed as it actually did.[11] This hypothetical employment status shows what the unemployment rate would have been if demographics remained unchanged since 2007.
Table 4 shows the actual and hypothetical change in the employment status of the adult population. The employment–population ratio fell by 4.4 percentage points, of which 4.0 percentage points remain after controlling for demographics. Similarly, 2.2 percentage points (5.4 million people) of the 2.8 percentage point (6.9 million people) decrease in labor force participation remains after controlling for demographic factors. Under one-quarter of the drop in labor force participation is due to demographic—not strictly economic—factors. The Federal Reserve Bank of Chicago has come to the same conclusion, finding that demographic factors accounted for one-quarter of the drop in labor force participation between 2008 and 2011.[12]

The Council of Economic Advisers recently concluded that demographic changes accounts for roughly half the drop in labor force participation.[13] They came to this conclusion by examining population aging in detail. While the CEA thoroughly examined population aging, they did not simultaneously control for education rates. The population has also become more educated since 2007, and more educated workers have greater attachment to the labor force. This factor should push labor force participation rates up.
Rerunning the analysis shown in Tables 3 and 4, but only accounting for aging would find demographics accounting for half the drop in labor force participation, as the CEA did. Accounting for aging and education simultaneously shows that demographics explains less than a quarter of the drop in labor force participation.
After accounting for demographics, three major categories of workers outside the labor force changed significantly between 2007 and 2013.[14] Increased retirements due to the aging population decreased the labor force participation rate by 1.2 percentage points.[15] Older workers have become much less likely to retire since 2007. If America’s demographic makeup had not changed between 2007 and 2013, lower retirement rates would have increased the labor force participation rate by 0.4 percentage points.
Controlling for demographics also changes the apparent magnitude of changes in those outside the labor force and attending school. The demographics-adjusted increase rises from 0.8 percentage point (1.9 million people) to 1.1 percentage points (2.7 million people). An aging population means fewer youth—those most likely to enroll in school. Controlling for this the increase in those not participating in the labor force and enrolled in school becomes even more pronounced. MORE